In last week’s blog post, we showed you six stocks with relative strength and the potential to show leadership IF overall broad market conditions started to improve.
Since then, the main stock market indexes have indeed been under control of the bulls, and all the major indices are now trading above their respective 20 and 50-day moving averages on the daily charts (a bullish signal).
Because the NASDAQ, S&P 500, and Dow Jones Industrial Average are now in rally mode, you may now be pondering whether current strength will just be a short-lived bounce off the lows or the start of a significant rally.
But asking whether or not the major indices will continue improving is the wrong question to ask. Continue reading to learn why…
Do You Need A Paradigm Shift?
While you may spend several hours each week analyzing charts of the NASDAQ, S&P 500, and Dow Jones Industrial Average, that valuable research time is much better spent scanning through a universe of stocks with relative strength instead (here is a quick and easy “self serve” way to do so).
Support and resistance levels of the major indices are important, but volatility can be very high at obvious levels of support and resistance.
As such, you are typically forced to endure numerous “head fakes” in the broad market before the true move reveals itself.
Therefore, focusing primarily on charts of the NASDAQ, S&P, and Dow as broad-based market volatility increases frequently leads to getting “shaken out” of your positions.
If this regularly happens to you, it’s time for a paradigm shift in your trading mentality to focus more on trade setups of leading individual stocks, rather than the main stock market indexes.
Your Quick & Efficient Stock Scanning Routine
To increase your odds of success in determining a market bottom, you need to run through a few stock scans during the week, making a list of stocks that are trading within 15-20% of their respective 52-week highs, while also forming a constructive basing pattern.
More specifically, you need to establish and stick to a simple weekly routine, where the same technical stock scans are run each and every week.
This doesn’t have to be extremely time consuming, and can be done on the weekend if the demands of life keep you too busy during the week.
How much you need to scan depends on the trading system being run, but one to two hours of flipping through charts while watching a baseball game isn’t too demanding.
Instead of relying on just a few chart patterns of the major indexes, your goal is to start referencing your own individual stock watchlist for confirmation of market sentiment.
After getting into the habit of running through your stock scans every week, you will eventually notice the number of stocks your watchlist expanding and contracting with the market.
If broad market conditions are improving, you should see confirmation in the form of an increasing number of stocks breaking out of solid bases to new “swing highs.”
If you do not see such confirmation, then be very cautious because something is amiss with the overall stock market.
What’s Hot Now
Current market conditions are improving, but more importantly, so is the breadth of leadership.
Nevertheless, current leadership is nowhere near as strong as it was in prior years.
This is to be expected considering the broad market is no longer in a strong uptrend and the major indices are all trading below their declining 200-day moving averages.
So, what are recent signs of strength?
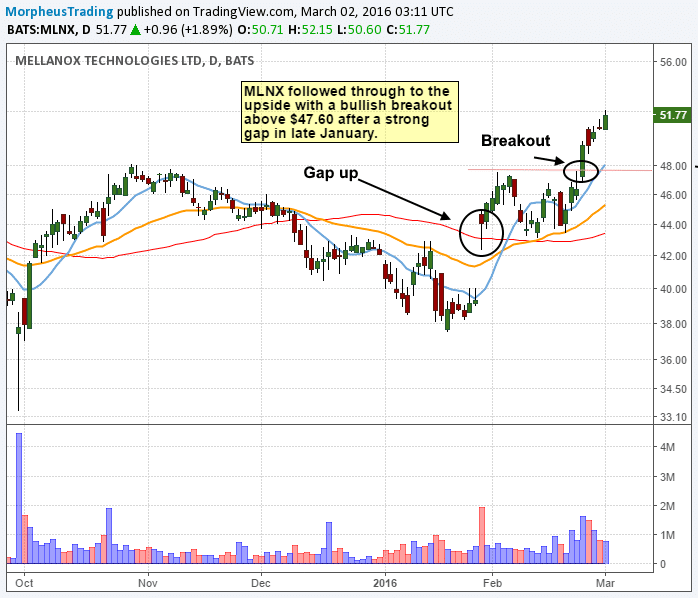
Breakouts in $MITK, $MLNX, $EBIX, $TXRH, $PYPL, $FSLR, $CRAY, $HIMX, $OCLR, and $RUTH are a few examples of strong stocks with leadership, and here are a few stock charts to show you the type of action we are looking for:

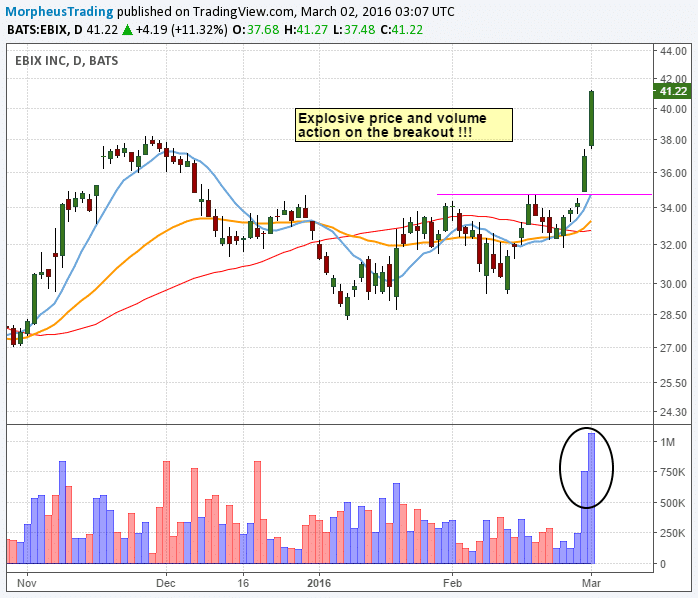
Next up is insurance software outsourcing company Ebix:

If you’re not already holding Ebix, it is not a positive reward-risk ratio to chase a buy entry at current levels, but you can stalk this stock for a low-risk buy entry on the pullback (an entry of $38-$39 could be nice).
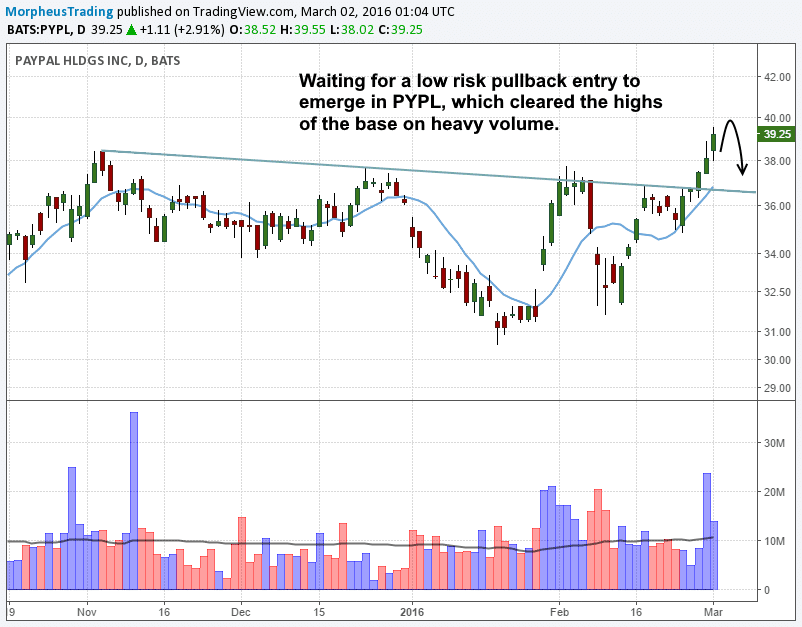
Online payment giant PayPal is another strong stock we like for pullback buy entry in the coming days:

Finally, on February 16, we posted on StockTwits that Mitek Systems ($MITK) was setting up for buy entry as it broke a key downtrend line.
In our nightly stock pick newsletter, we have been long Mellanox Technologies ($MXL) since our February 24 entry of $14.97 and are currently showing an unrealized gain of 11.6% as of yesterday’s close.
Since then, the stock has jumped a whopping 22% and is still going strong (we also highlighted this stock in this February 25 blog post).
Good Habits = Consistent Trading Profits
Some traders obsess over stock charts and stare at them all night long in an attempt to predict future price action, but don’t stress yourself out by falling into this trap.
Instead, simply get in the habit of screening for leading stocks every week and ask yourself, “Are there any bullish chart patterns?” If so, what industry sector do they belong to? Is their confirmation in the form of group strength as well?
Doing the above will not guarantee you will become a better trader in the short-term, but developing a solid and consistent work ethic should eventually produce positive results (assuming your risk management is also in line).
While the herd focuses on whether or not the NASDAQ will bust through this level or that level, you now have the inside edge to knowing what really matters — the performance of leading individual stocks.
Although there is no substitute for hard work and consistency in the stock trading business, building and continually monitoring your list of leading stocks is an excellent “shortcut” to knowing the true sentiment of the market and becoming a consistently profitable trader.
Sign up now for your risk-free subscription to The Wagner Daily and be instantly alerted to our exact entries, stops, and target prices of the best stock trade setups in the market every day.

I love the blog, thanks for taking the time to write it. One question I have is on “leading stocks”. What is the gauge for this – price movement, earnings, or is it just bigger players in each industry?
Leading stocks are ones that are trading near 52-week highs, that have held up best during market a market correction (relative strength). These stocks should have decent liquidity and not average 50,000 shares a day. Maybe 250,000 is a decent min. for average volume.
While the market sells off, these stocks are forming a valid basing pattern, and when the pressure of the market comes off they can make explosive moves.
Along with relative strength, these stocks tend to have either top notch fundamentals and or belong to a very strong industry group. Once you know what to look for, they tend to stick out like a sore thumb…..there just aren’t that many $PYPLs and $MXLs around!
Thanks Rick, that makes sense to me!