 We’ve begun seeing a bit of sector rotation lately, with leading stocks and sectors cooling off and formerly lagging industries seeing a bit of buying interest.
Institutional sector rotation is common in bull markets, and the rotation of funds from one industry to another enables broad-based uptrends to remain intact, even when certain sectors are “overbought” (we hate that useless word).
The Technical Indicator That Never Lies
How do we know when sector rotation is taking place?
The easiest way to spot it is through observing changes in volume, one of the most reliable and useful technical indicators at our disposal.
Since institutional trading accounts for roughly 80% of the stock market’s average daily volume, the price action of stocks and ETFs is typically driven by the actions of the “smart money.”
Analysis of volume patterns tells us which side of the market banks, mutual funds, hedge funds, and other institutions are on.
If, for example, an equity is under distribution (institutional selling), it will eventually drop.
Conversely, an equity will eventually rise if under accumulation (institutional buying).
For this reason, volume is considered a leading indicator, rather than a lagging one.
This is why our trading system is based on always following the dominant stock market trend (riding on the coattails of institutions).
So, Where’s The Money Flowing?
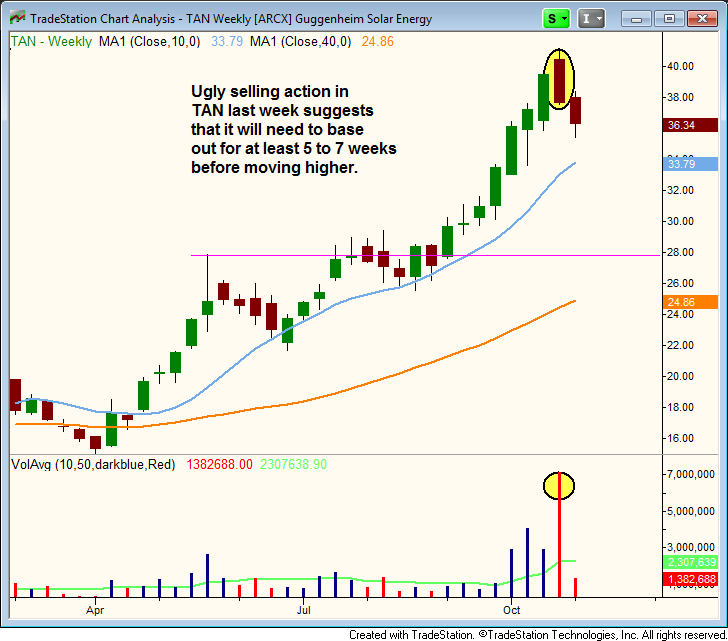
Solar energy, one of the leading sectors of the last wave up in the market, is one example of an industry that has recently come under distribution.
This can be seen on the weekly chart of Guggenheim Solar ETF ($TAN), an ETF we recently sold for a 44% gain in The Wagner Daily newsletter:

Notice the massive volume spike that accompanied last week’s 4.6% sell-off at the highs, which has so far led to further selling this week.
That high volume decline is the biggest clue that this ETF is now in correction mode, and may now need to form a base of consolidation for the next month or more.
Specifically, we expect $TAN to come into support of its 10-week moving average (teal line) before it could be considered a low-risk re-entry on the buy side.
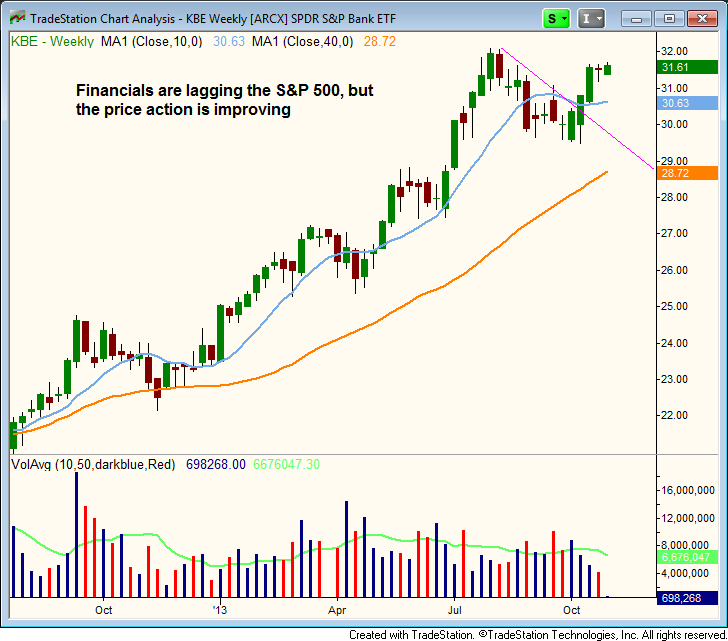
As for sectors seeing an inflow of institutional funds, we are seeing improving price action in Financials.
On the weekly chart below, notice that S&P SPDR Bank ETF ($KBE) is now trading at its highest level of the past several weeks:

Although the banking sector has been lacking relative strength to the S&P 500, $KBE is staging a bit of a comeback after living below its 10-week MA from late August to early October.
$KBE is back above its 10-week moving average, and the price action moving in a tight, sideways range above the rising 20-day exponential moving average on the daily chart (not shown).
Volume in $KBE has actually been declining over the past several weeks, but that is actually bullish when an equity is consolidating because it tells us sellers are not stepping in as the bulls take a rest.
However, it will be important to see the confirmation of higher volume if/when $KBE breaks out above the highs of its range.
Watch $KBE and financial stocks for continued signs of bullish sector rotation, which may make it possible to buy a cup and handle breakout in this sector.
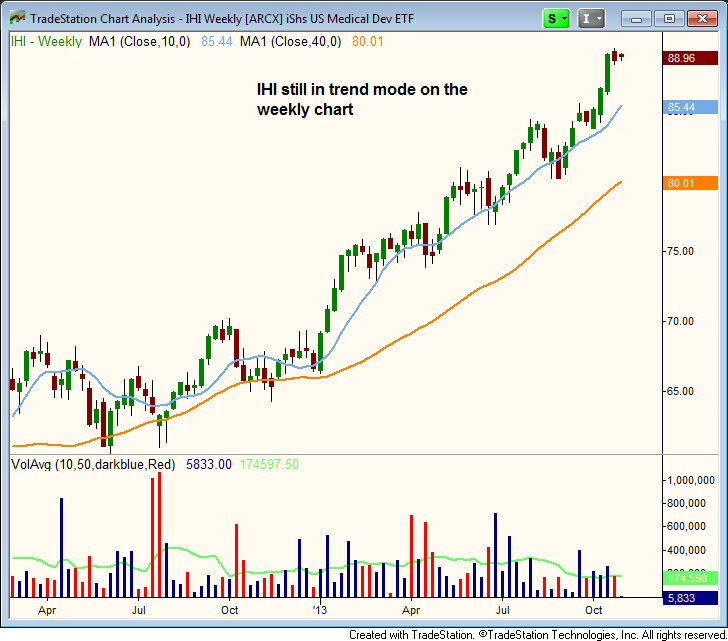
The iShares US Medical Devices ETF ($IHI) is an ETF that has not only been a market leader for many months, but continues to hold near its highs without signs of distribution.
$IHI broke out from its last base three weeks ago, and the price is still trading near its highs (above the 10-day moving average on the daily chart). The weekly chart below shows the strong uptrend:

Another sector we have our eyes on right now is precious metals, specifically gold and silver ETFs ($GLD and $SLV respectively).
Although gold and silver have been stagnant for quite some time, their weekly charts are now showing the formation of significant “higher lows.”
As such, a bullish trend reversal may be shaping up in the coming weeks. As always, we will alert subscribers if $GLD or $SLV become actionable.
Overall Stock Market Pulse
As for the general health of the broad market, individual leadership stocks have begun showing a bit of relative weakness to the broad market averages lately, but mostly remain in good shape.
Since the performance of individual leading growth stocks is one of the most important indicators of our market timing system, we are continuously on alert for any red flags that could hint at a substantial stock market correction.
Nevertheless, unless leading stocks begin breaking down below their 50-day moving averages en masse, we are not concerned about a healthy pullback and normal sector rotation in the market.
By the way, please note that several leading stocks are scheduled to report quarterly earnings within the next few weeks. For example, both $LNKD and $YELP report after today’s (October 29) close.
The reaction to earning reports of leading stocks (NOT the earnings numbers themselves) will tell us a lot about the health of the market.
By the first or second week of November, we should have a pretty good idea as to whether or not persistent bullish momentum will at least carry itself through the end of the year.
To be alerted of sudden changes to our market timing model (a rule-based strategy of knowing when and how aggressive to be in the market), and to receive our best nightly stock and ETF picks, sign up now for your 30-day risk-free subscription to our swing trading newsletter.
