market timing model: SELL Signal generated on close of Sept. 9
Last Friday’s breakdown generated a sell signal. One can still be long stocks that are holding up well.
Note that the market timing model was not created to catch tops and bottoms in the S&P 500. The model was designed to keep our trades in line with the prevailing market trend. Buy signals (confirmed) are generated when the price and volume action of leading stocks and the major averages are in harmony. This means that we could potentially have a buy signal in a major market average, but if leading stocks are not forming bullish patterns, then we are forced to remain on the sidelines until patterns improve.
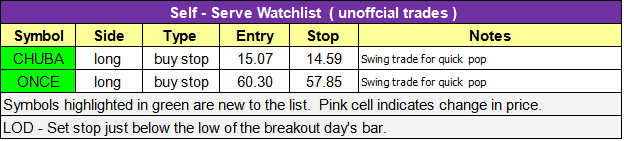
today’s watchlist (potential trade entries):

Having trouble seeing the open positions graphic above? Click here to view it directly on your web browser instead.
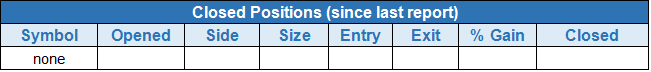
open positions:
Below is an overview of all open positions, as well as a report on all positions that were closed only since the previous day’s newsletter. Changes to open positions since the previous report are listed in pink shaded cells below. Be sure to read the Wagner Daily subscriber guide for important, automatic rules on trade entries and exits.

Having trouble seeing the open positions graphic above? Click here to view it directly on your web browser instead.
closed positions:
Having trouble seeing the closed positions graphic above? Click here to view it directly on your web browser instead.
position notes:
- No trades were made.
Broad market indices posted an inside day on Tuesday, which is to be expected following Monday’s big advance. The Nasdaq Composite, Nasdaq 100, and Russell 2000 are sitting right at the 50-day MA, and given Tuesday’s late bottoming action intraday on the chart below, could be headed higher in the short-term.
Note the rounding action at the lows on the 5-minute chart of the Russell 2000 ETF ($IWM):
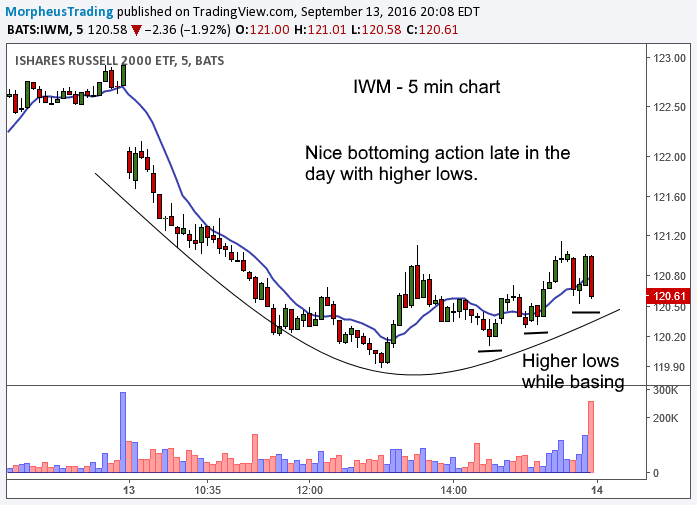
Look for the market to bounce higher on Wednesday and Thursday, followed by some stalling or further selling on Friday due to quadruple options expiration. Unless there is strong follow through to the upside on heavy volume, we would expect any rally to be short lived and eventually give way to more sideways chop (backing and filling),
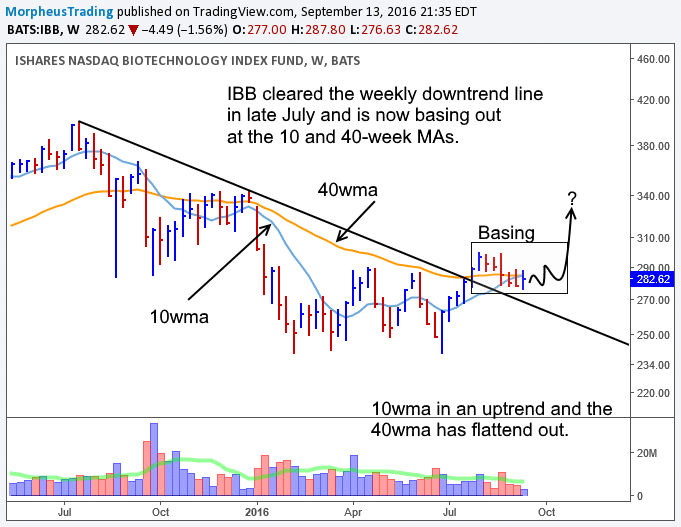
Biotech ETF ($IBB) is one of the few ETFs that is in great shape right now, forming a base above the downtrend line it cleared earlier in the summer. The 10-week MA is in a clear uptrend and has crossed above the 40-week MA, which suggests the potential for a major trend reversal.
Biotech stocks could be back in play soon, which would help the Nasdaq move off the 50-day MA.
With the market yet to stabilize, we don’t mind sitting in a few stocks and waiting for conditions to improve. Short-term swing trades for a quick pop may be in play on Wednesday. Please see our self-serve watchlist for setups. These trades are not official and will not be tracked.
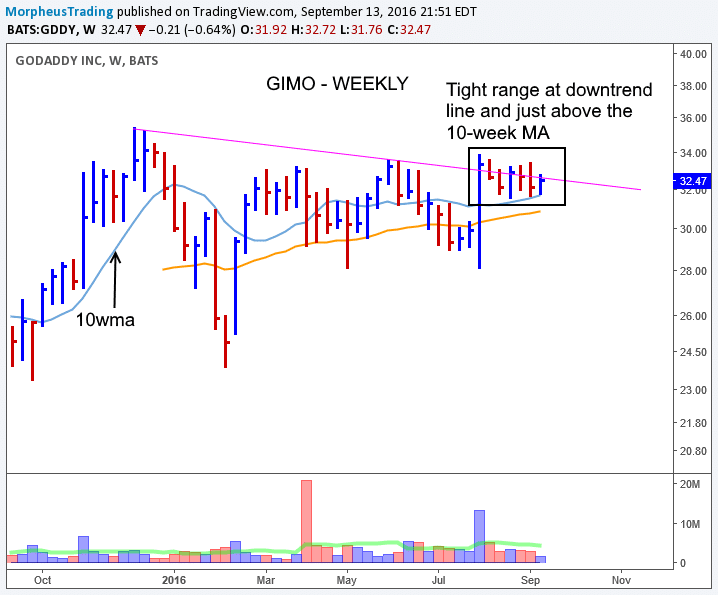
$GDDY is in pretty good shape, forming a 6-week base above the 10 and 40-week MAs, while sitting right at the downtrend line on the weekly chart below. Volume has declined during the consolidation which is a bullish sign.
The price action has tightened up this week so far and could potentially be in play with a move above $32.85 on volume (heavy volume would confirm the entry).
There is no official entry point in $GDDY, but we will continue to monitor the action.
This is an unofficial watchlist of potential setups for today’s session (trade results will not be monitored). This list is for experienced traders only who are looking for a few ideas. No targets will be listed. Please check for earnings before entering.
All stops are on a closing basis unless listed as a “hard” stop.