market timing model: SELL Signal generated on close of Sept. 9
Last Friday’s breakdown generated a sell signal. One can still be long stocks that are holding up well.
Note that the market timing model was not created to catch tops and bottoms in the S&P 500. The model was designed to keep our trades in line with the prevailing market trend. Buy signals (confirmed) are generated when the price and volume action of leading stocks and the major averages are in harmony. This means that we could potentially have a buy signal in a major market average, but if leading stocks are not forming bullish patterns, then we are forced to remain on the sidelines until patterns improve.
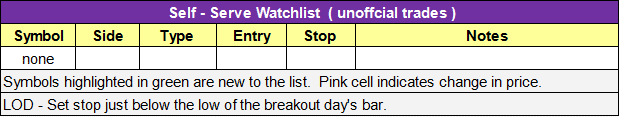
today’s watchlist (potential trade entries):

Having trouble seeing the open positions graphic above? Click here to view it directly on your web browser instead.
open positions:
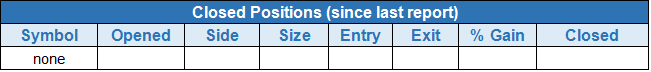
Below is an overview of all open positions, as well as a report on all positions that were closed only since the previous day’s newsletter. Changes to open positions since the previous report are listed in pink shaded cells below. Be sure to read the Wagner Daily subscriber guide for important, automatic rules on trade entries and exits.

Having trouble seeing the open positions graphic above? Click here to view it directly on your web browser instead.
closed positions:
Having trouble seeing the closed positions graphic above? Click here to view it directly on your web browser instead.
position notes:
- Note the changes to stops.
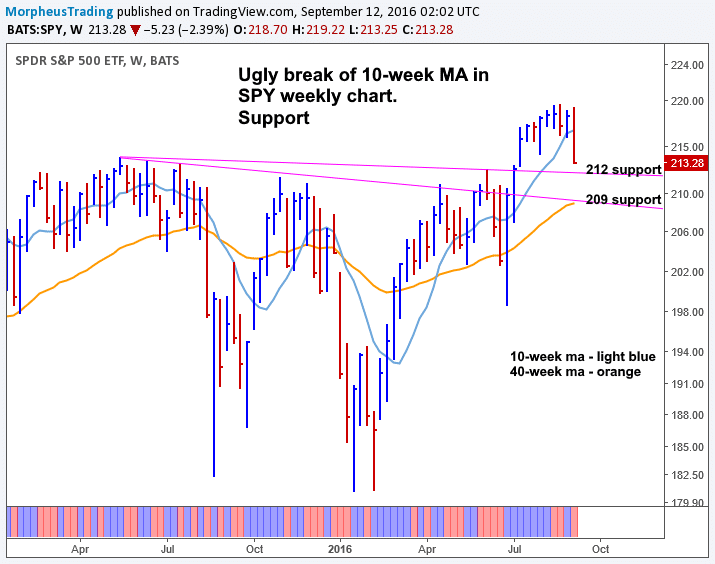
Friday’s nasty selloff generated a sell signal in our timing model. All broad market indices were down -2% or more, with the Dow Jones, S&P 500, and S&P 400 slicing through the 50-day MA. In the short-term, there really is no reason to be long unless holding on to an intermediate-term trade that has shown exceptional strength.
$SPY support levels are at $212 and $209. There is significant support at $209 from the 40-week MA, prior downtrend line, and prior highs around $210.
With the model on a sell signal, our concern shifts to reducing risk and taking profits in positions that are extended.
Below is a quick review of open positions:
$BABA – Sticking with the full position for now (no panic here). We do have a pretty tight stop on a closing basis for the last add at $97.21.
$LMAT – We have a tight stop in place to preserve profits. No need to hold on to this swing trade with the market below the 50-day MA.
$OLLI – Hard stop in place due to breakdown below 50-day MA.
$PYPL – Break even stop in place. If we are stopped out we can re-enter when broad market conditions improve.
$STS – Selling on open due to false breakout at highs (bad timing for breakout when market failing).
$RSYS – Note there is a hard stop in place, but no change in stop.
$HBP – Selling on open due to break of 50-day MA.
Last Friday’s selling was brutal, which is why we are forced to sell some stocks on the open. Stops are pretty close on other positions, so we do not have a ton of risk out there. Depending on how $BABA reacts, we may be able to hold most or all of the position through any pullback (up to the stock, not us). Be careful out there. Stick with positions that have shown you something, but get out of those that haven’t.
This is an unofficial watchlist of potential setups for today’s session (trade results will not be monitored). This list is for experienced traders only who are looking for a few ideas. No targets will be listed. Please check for earnings before entering.
All stops are on a closing basis unless listed as a “hard” stop.