Signal generated on close of July 7
Bull market rally. Long exposure can be in the 50 – 100% range or more depending on success of open positions.
Note that the market timing model was not created to catch tops and bottoms in the S&P 500. The model was designed to keep our trades in line with the prevailing market trend. Buy signals (confirmed) are generated when the price and volume action of leading stocks and the major averages are in harmony. This means that we could potentially have a buy signal in a major market average, but if leading stocks are not forming bullish patterns, then we are forced to remain on the sidelines until patterns improve.
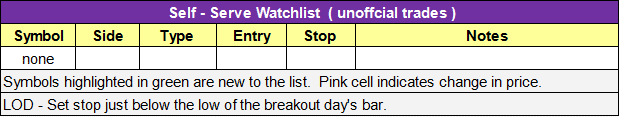
today’s watchlist (potential trade entries):

Having trouble seeing the open positions graphic above? Click here to view it directly on your web browser instead.
open positions:
Below is an overview of all open positions, as well as a report on all positions that were closed only since the previous day’s newsletter. Changes to open positions since the previous report are listed in pink shaded cells below. Be sure to read the Wagner Daily subscriber guide for important, automatic rules on trade entries and exits.

Having trouble seeing the open positions graphic above? Click here to view it directly on your web browser instead.
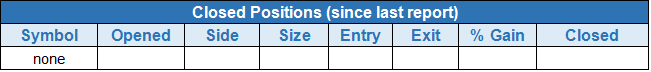
closed positions:
Having trouble seeing the closed positions graphic above? Click here to view it directly on your web browser instead.
position notes:
- No trades were made.
Broad market indices are building momentum in the short-term, with the 5-day MA now turning up on the daily charts of the S&P 500 and Nasdaq Composite. Look for the main indices to trend higher in the short-term as long as they stay above the 20-period EMA on the hourly chart.
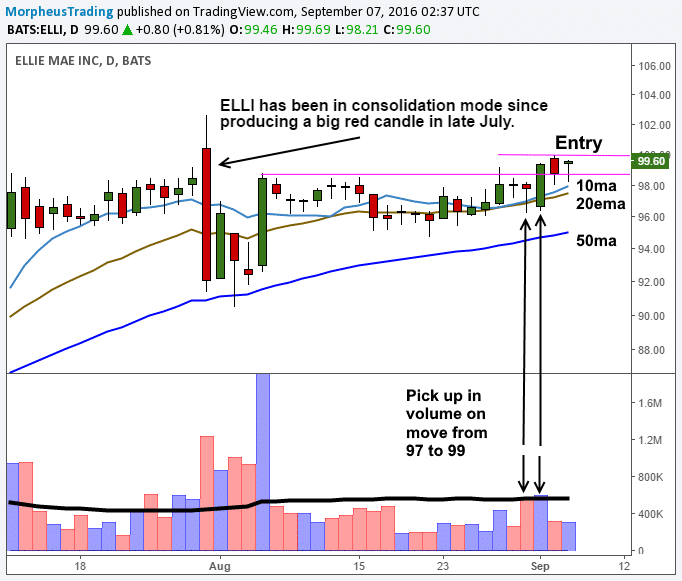
No trades were made on Tuesday, but we do have one new buy setup listed in Wednesday’s watchlist. The setup is a breakout entry over last week’s high in $ELLI, which has been in consolidation mode for several weeks since printing an ugly red candle in late July.
Last Thursday (9/1), $ELLI rallied nearly 3% on heavier than average volume and closed at the highs of the session. Since then, it has chopped around in a tight range on the hourly chart.
Our buy stop entry is over the two-day high, which is also above last week’s high and last month’s high as well. We have a split stop in place to guard against an immediate false breakout. The stop for the first half is hard, meaning we will sell right away if triggered. The stop on the second half is on a closing basis, and is below the 50-day MA.
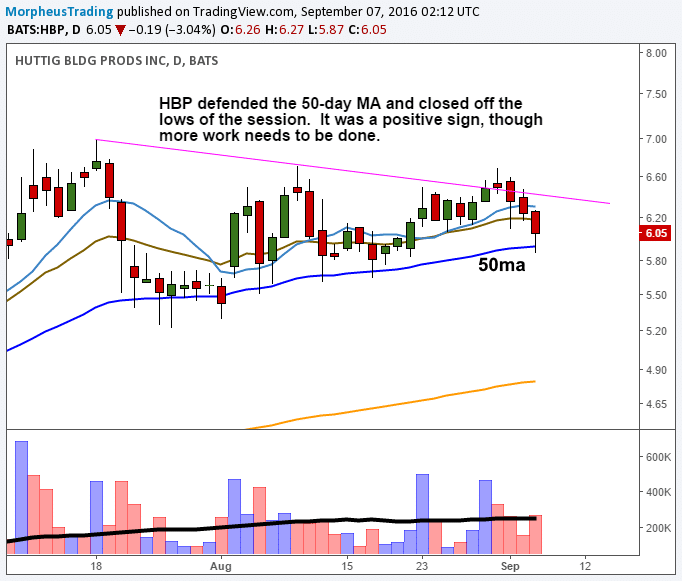
$HBP managed to close off the lows of the session after defending the 50-day MA all day long. If the trade is to remain good in the short-term, then it should bounce higher within the next few days. A break of Tuesday’s low on a pick up in volume would negate the trade.
Note the $MIME stop is no longer hard. However, if the price action fails to reverse higher and closes below $17.09, then we will likely sell on the next day’s open at the market.
Please note all the hard stops in the open positions section. Cells highlighted in red indicate a hard stop, which means the position is sold right away when the stop triggers. All other stops are on a closing basis, and are sold the following day after closing below a stop.
This is an unofficial watchlist of potential setups for today’s session (trade results will not be monitored). This list is for experienced traders only who are looking for a few ideas. No targets will be listed. Please check for earnings before entering.
All stops are on a closing basis unless listed as a “hard” stop.